
Healthcare payers have been required to disclose negotiated rates with providers since 2022. Today, most have complied, meaning there is abundant data on how much various payers are compensating hospitals for various services.
There’s so much data, in fact, that it can be difficult to know where to start when using it to negotiate pricing contracts. In this post, we’ll highlight four data points hospitals can look at to empower their next round of payer price negotiations. To illustrate our recommendations, we’ll refer to data we pulled on 69 billable services at six hospitals in Indianapolis, Indiana.
1. Median Prices
If you’ve taken the time to download any payer pricing files, you know that they contain a lot of data. CMS requires payers to disclose negotiated prices for each payer plan for each service at each hospital a payer works with.
In some cases, a single-payer might have dozens of plans with a given hospital, meaning there’s no one reimbursement rate for a single service. This, of course, makes it more complicated to assess what hospitals are being paid for their work.
Our advice: look at median prices per payer for your market.
While average prices are impacted by outliers on both the high and low end, medians offer a more balanced look: what price is in the exact middle of all the prices a payer pays for a service to a given provider?
One starting point is to identify the median compensation you receive from a given payer for a given service, then compare that to what they’re paying other hospitals in your area.
2. Comparable Plan Rates at Nearby Hospitals
This is a key comparison point because it gives you a sense of how a given payer is compensating your direct competition compared with how it is compensating you. Again, we recommend looking at median prices per service.
For example, in Figure 1, you can see the median rate Anthem (now Elevance) pays Ascension St. Vincent Hospital in Indianapolis, for various CT scans, and how those rates compare with five other hospitals in Indianapolis, as well as how they compare with median payments for these services at US hospitals as a whole.
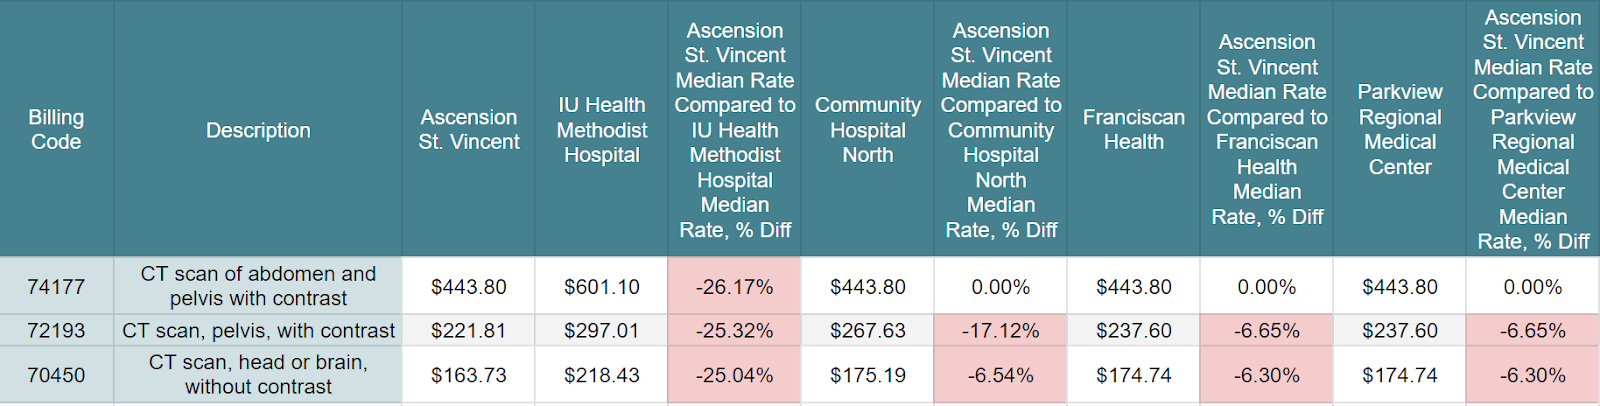
Figure 1: Anthem (Elevance) compensation rates for CT scans at 6 Indianapolis hospitals
Obviously, raw numbers only tell part of the story. Maybe a highly compensated provider has an award-winning department for the services in question, for example. But having actual numbers in hand means hospitals can come to rate negotiation conversations with detailed, accurate information they can use to advocate for competitive compensation.
3. Competitor Plan Rates at Nearby Hospitals
Knowing how a payer is compensating other facilities is important; another powerful tool is having precise numbers for how other payers are compensating your facility and others in your region for a given service.
While Anthem (Elevance) has largely consistent pricing across services for the six hospitals outlined here, UnitedHealthcare reimbursement rates are much more varied.
In fact, when we looked at 69 billing codes for these six facilities, we found rate differences of more than 15 percent between the highest-compensated hospital in the region (Indiana University Health Methodist Hospital) and others. Specifically…
- Community Hospital North receives at least 15 percent less than the IU facility for 59 billing codes.
- Parkview Regional Medical Center receives at least 15 percent less for 62 billing codes.
- Franciscan Health receives at least 15 percent less for 60 billing codes.
In Figure 2, you can see that the variances for CT scan reimbursement by UnitedHealthcare are greater than those from Anthem (Elevance), above.
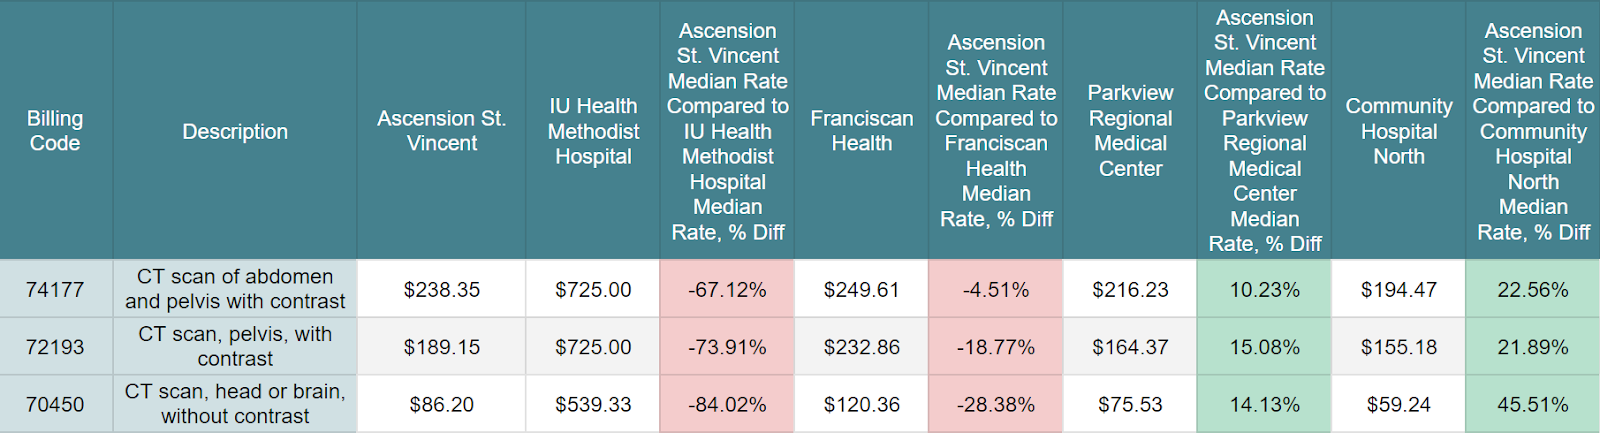
Figure 2: UnitedHealthcare compensation rates for CT scans at 6 Indianapolis hospitals
4. Plan Pricing at Nationally Competitive Hospitals
For some services, patients typically choose among the facilities in their geographic region. For others – like complex knee surgery, for example, or treatment of rare or childhood conditions – they may consider facilities further afield.
If your hospital competes with facilities outside your geographic region, it’s a good idea to look at how payers are compensating those facilities for services as well. Cincinnati Children’s Hospital, for example, considers rates that payers pay other children’s hospitals when pulling data for rate negotiations.
The Power of Payer Pricing Data
In our analysis, we were able to see not only reimbursement differences for individual services but also big-picture payment gaps. For example, at one of the hospitals in our analysis, we found 76 instances where the provider was underpaid by 15 percent or more compared with regional leaders. In another instance, the provider was underpaid in 143 instances.
This kind of macro data can inform how aggressively a provider approaches negotiation conversations and pursues rate adjustments.
If you’re interested in a custom data report to inform your next round of payer pricing negotiations, please reach out. We can not only put together a dashboard with exactly the data points you need, we can also offer you access to the data and our dashboards for free for one month so you can assess its value to your organization.