Pricing Analytics for Hospitals
To date, the CMS’s hospital price transparency rule presented hospitals with new requirements for disclosing pricing data in a way that complies with the rule’s guidelines.
With our analytics capabilities, though, hospitals can now enjoy unprecedented access to insights about pricing practices among their competitors and even around the country.
To get a sense of what’s possible, take a look at this breakdown of pricing information for two shoppable services (bilateral mammography and MRI brain scans) at five Minneapolis-area hospitals.
In order to load live Looker data if you are using Safari, ensure that your privacy settings allow for cross website tracking. This can be found under Privacy in Safari Preferences.
Mammography Prices Are Just the Start of the Story
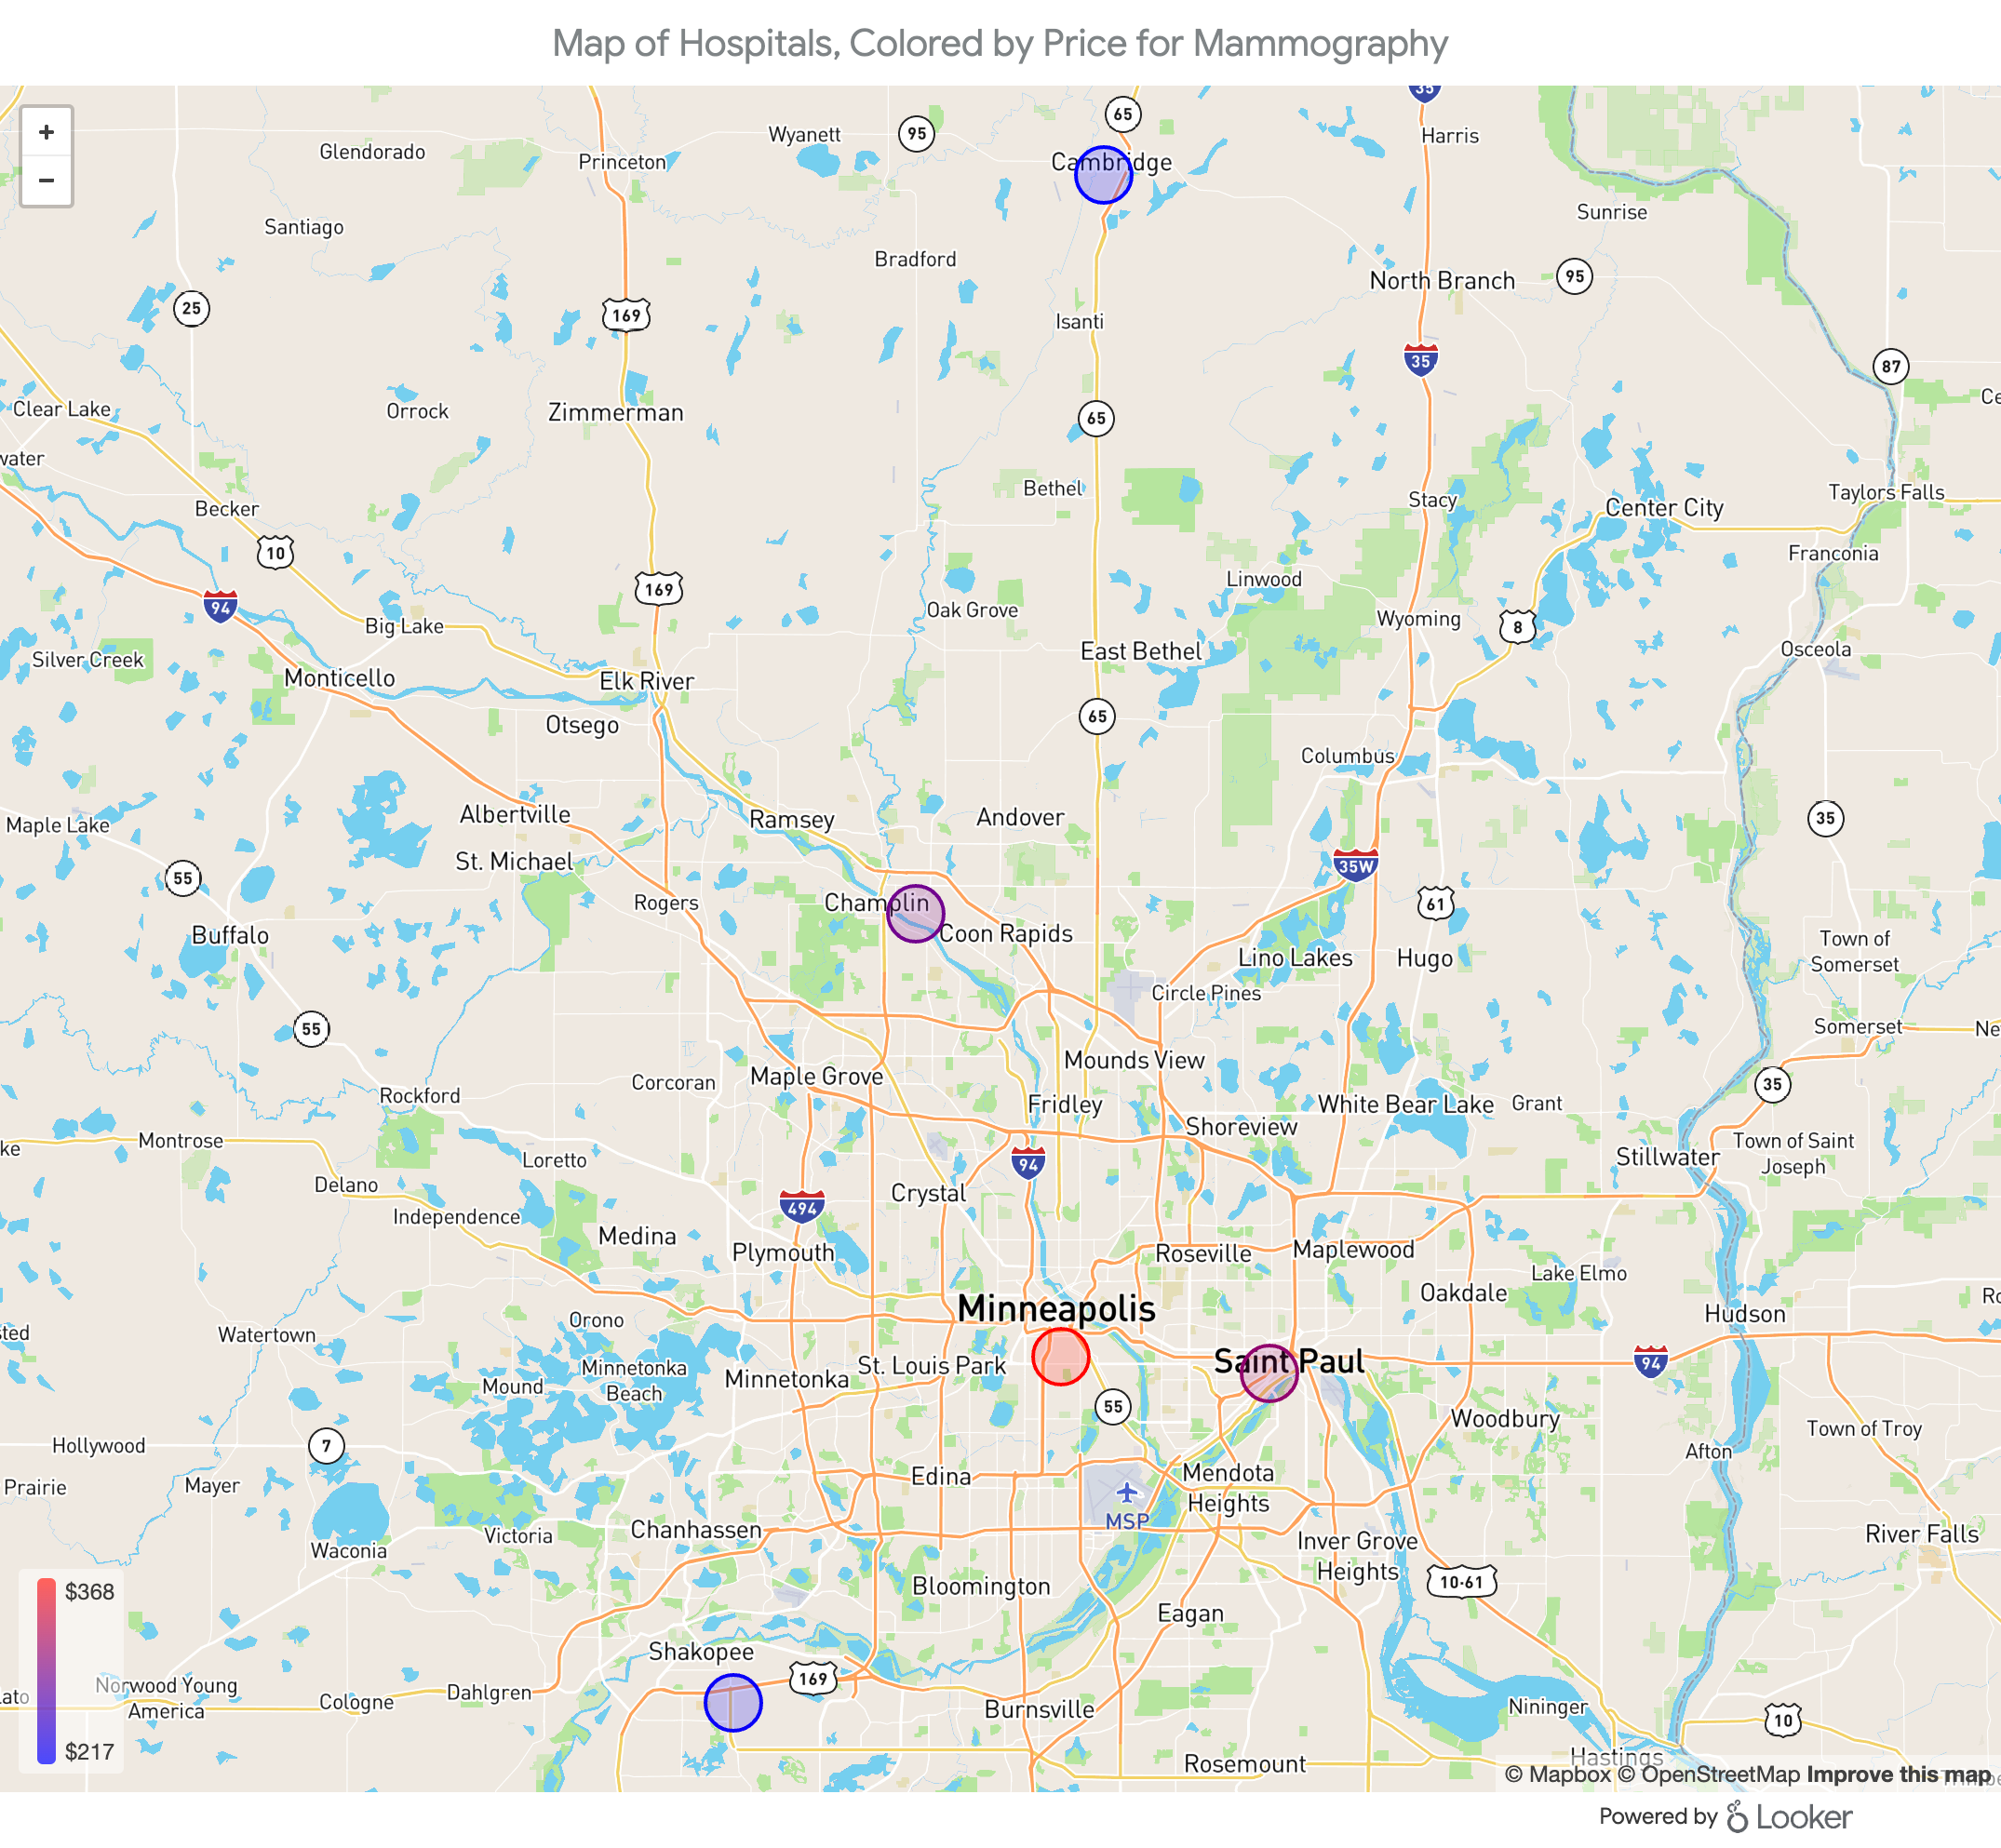
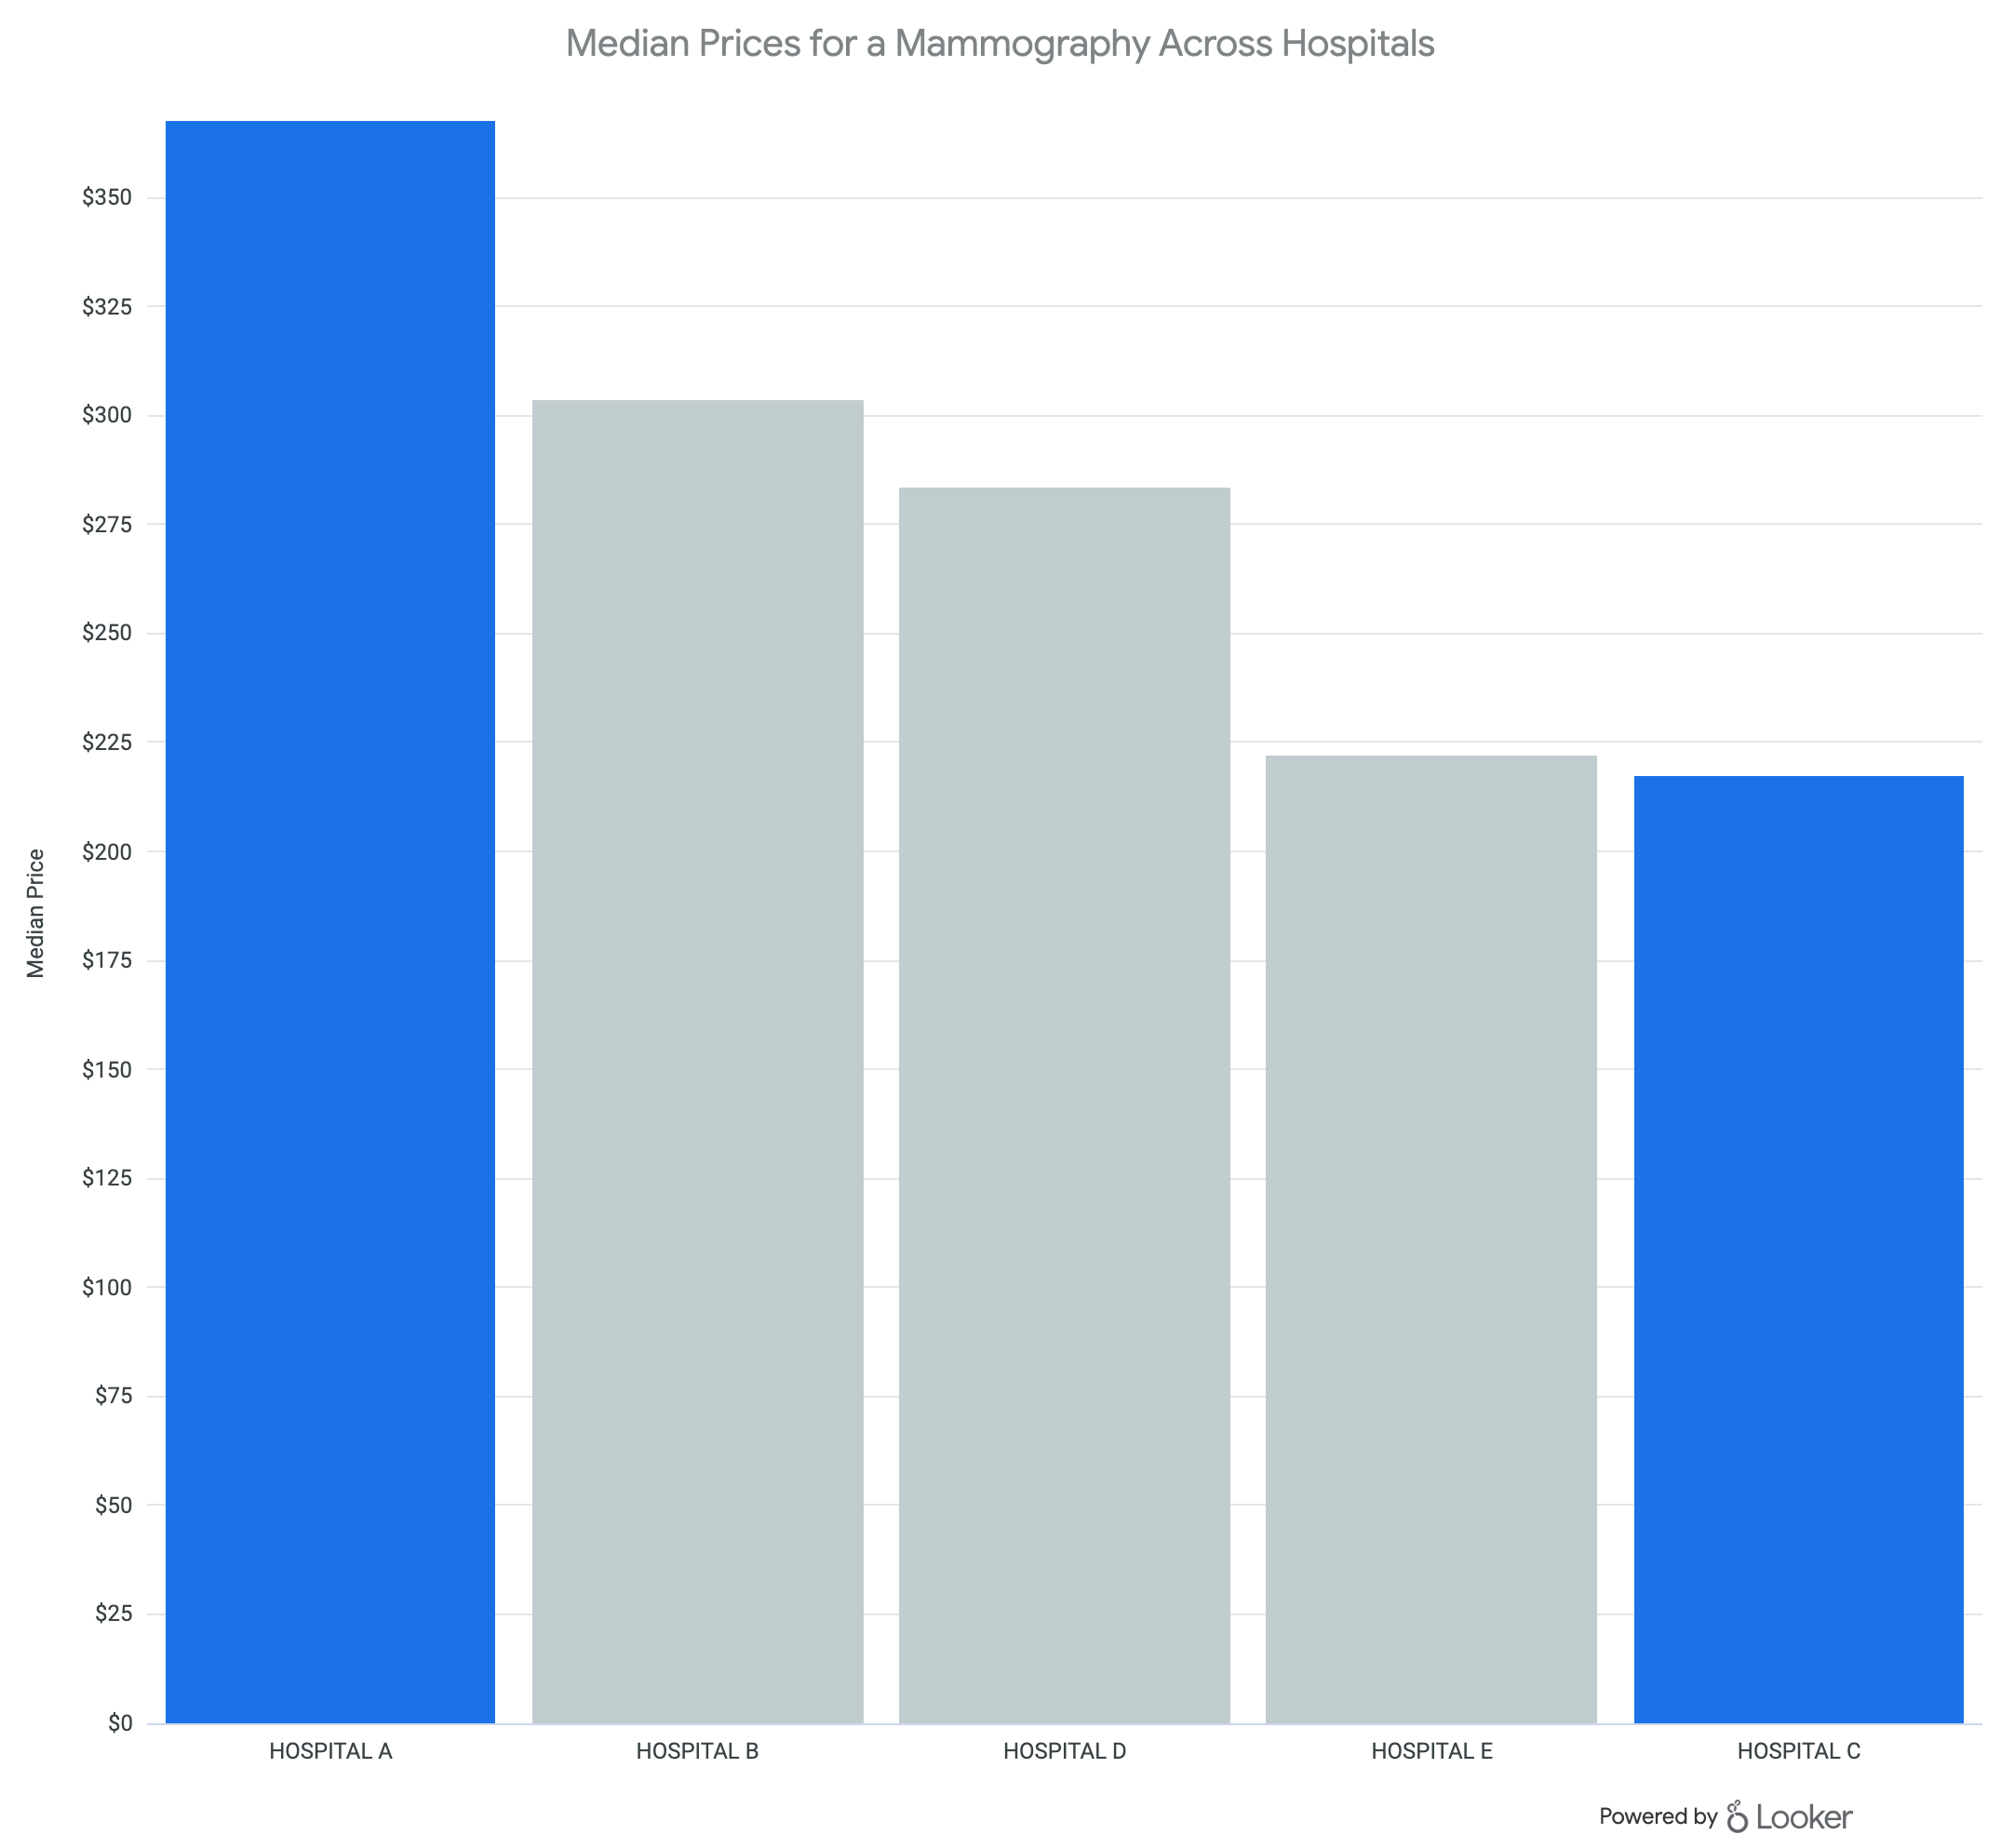
For the purposes of this sample analysis, we looked at median prices (those at the middle of our data set) to eliminate the impact of outliers. For bilateral mammography services (one of the services hospitals are required to publish prices for) in the greater Minneapolis region, median negotiated prices ranged from $222 (at Hospitals E and C) to $384 (at Hospital A).
In other words, the highest median negotiated price is 73 percent greater than the lowest median negotiated price. For context, this would be akin to the cost of a MacBook ranging from $1,200 to $2,076, depending on where it was purchased.
Of course, most hospitals would argue that that’s not a totally fair comparison. A facility with state-of-the-art equipment and best-in-class patient care may well be justified in charging more for its services than its competitors.
A more apt metaphor, then, might be the cost difference between a top-of-the-line laptop with extra memory and processing power, designed for hardcore data processing, and a baseline model designed for elementary school students.
No one would argue that those two models should cost the same.
As pricing data becomes more visible to consumers, then, it will become increasingly important for hospitals to communicate their unique value propositions to consumers who are newly empowered to comparison shop.
Greater Variation in MRI Brain Scan Prices
Let’s look now at the median negotiated prices of MRI brain scans at those same five Minneapolis-area hospitals.

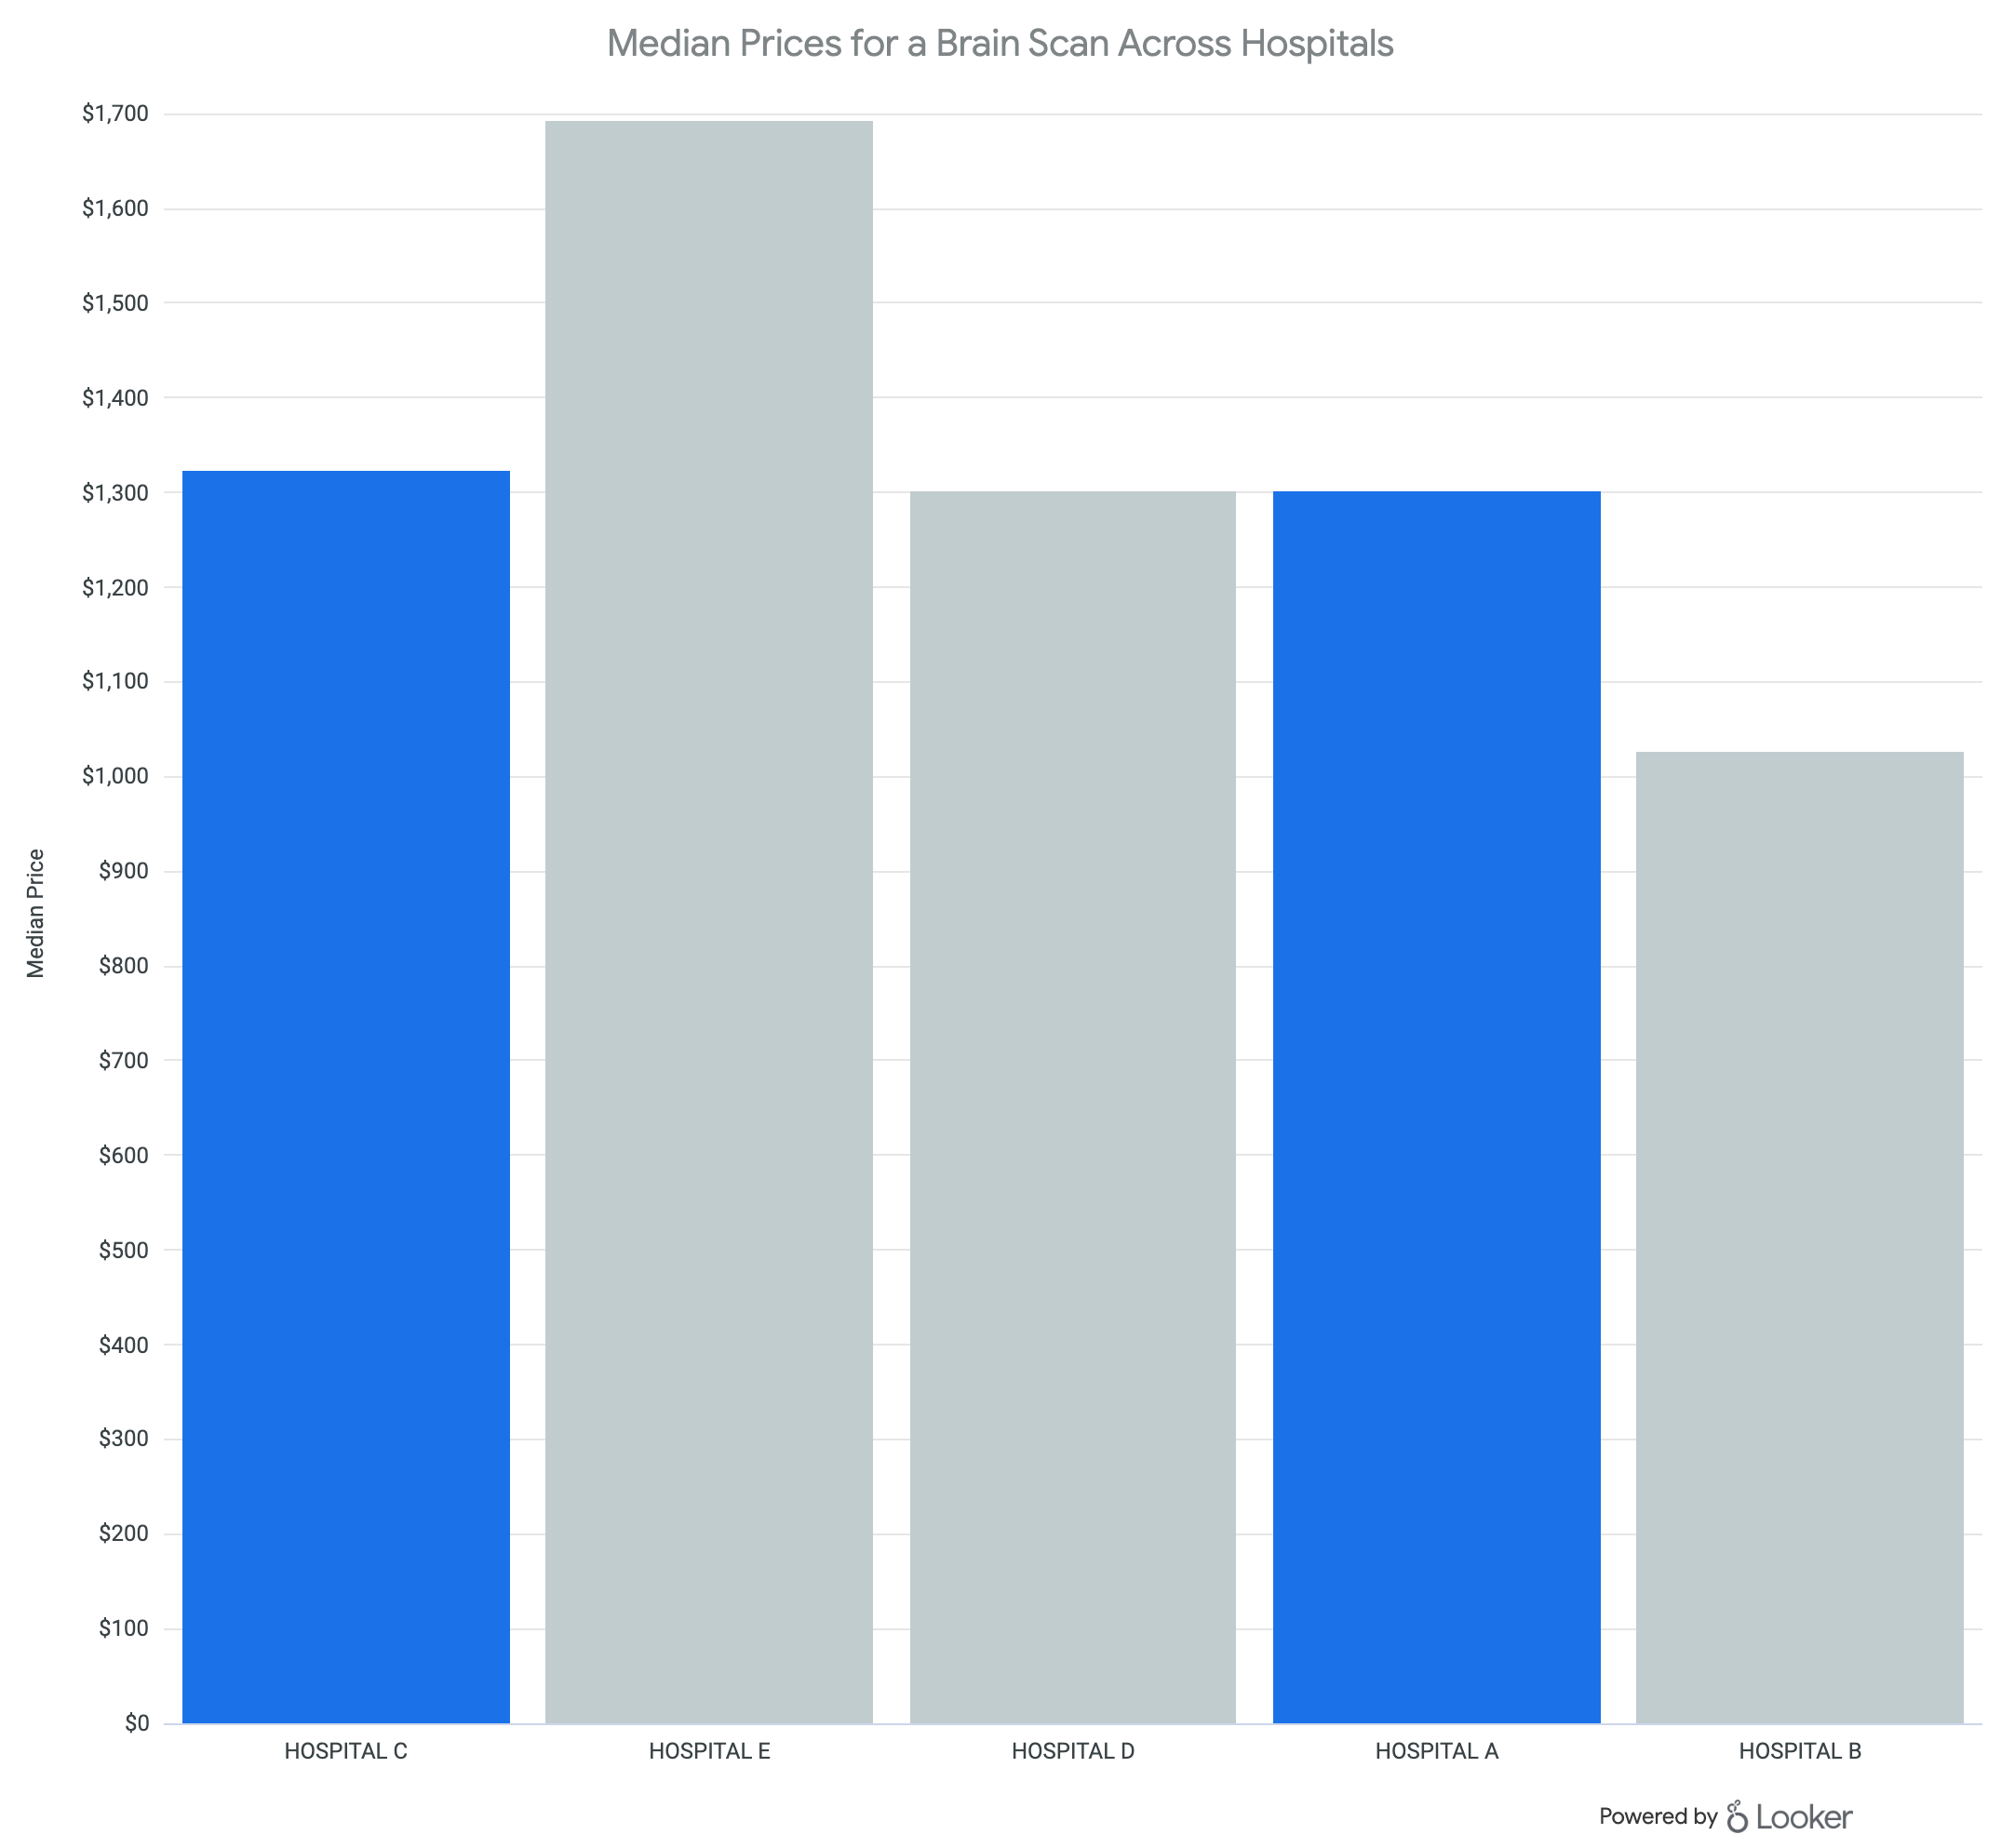
For this shoppable service, the cost distribution is wider: from $1,026 at Hospital B to $2,113 at Hospitals C and E. In other words, the most expensive hospital charges more than twice what the least expensive hospital charges.
What’s notable here is that the hospital with the highest prices for mammography is actually among the least expensive places to get an MRI, and the highest-priced MRI is available at the same hospital as the lowest-priced mammography services.
Still, this view of median prices suggests that different facilities specialize in different care and price their services accordingly. The story gets more complicated, though, when we look not at median prices but at the range of negotiated prices at a single hospital among various payer-plans.
A Look at the Range of Negotiated Prices Complicates the Narrative
Let’s look now at histograms that illustrate the concentration of payer-plans at various negotiated price points for mammography.
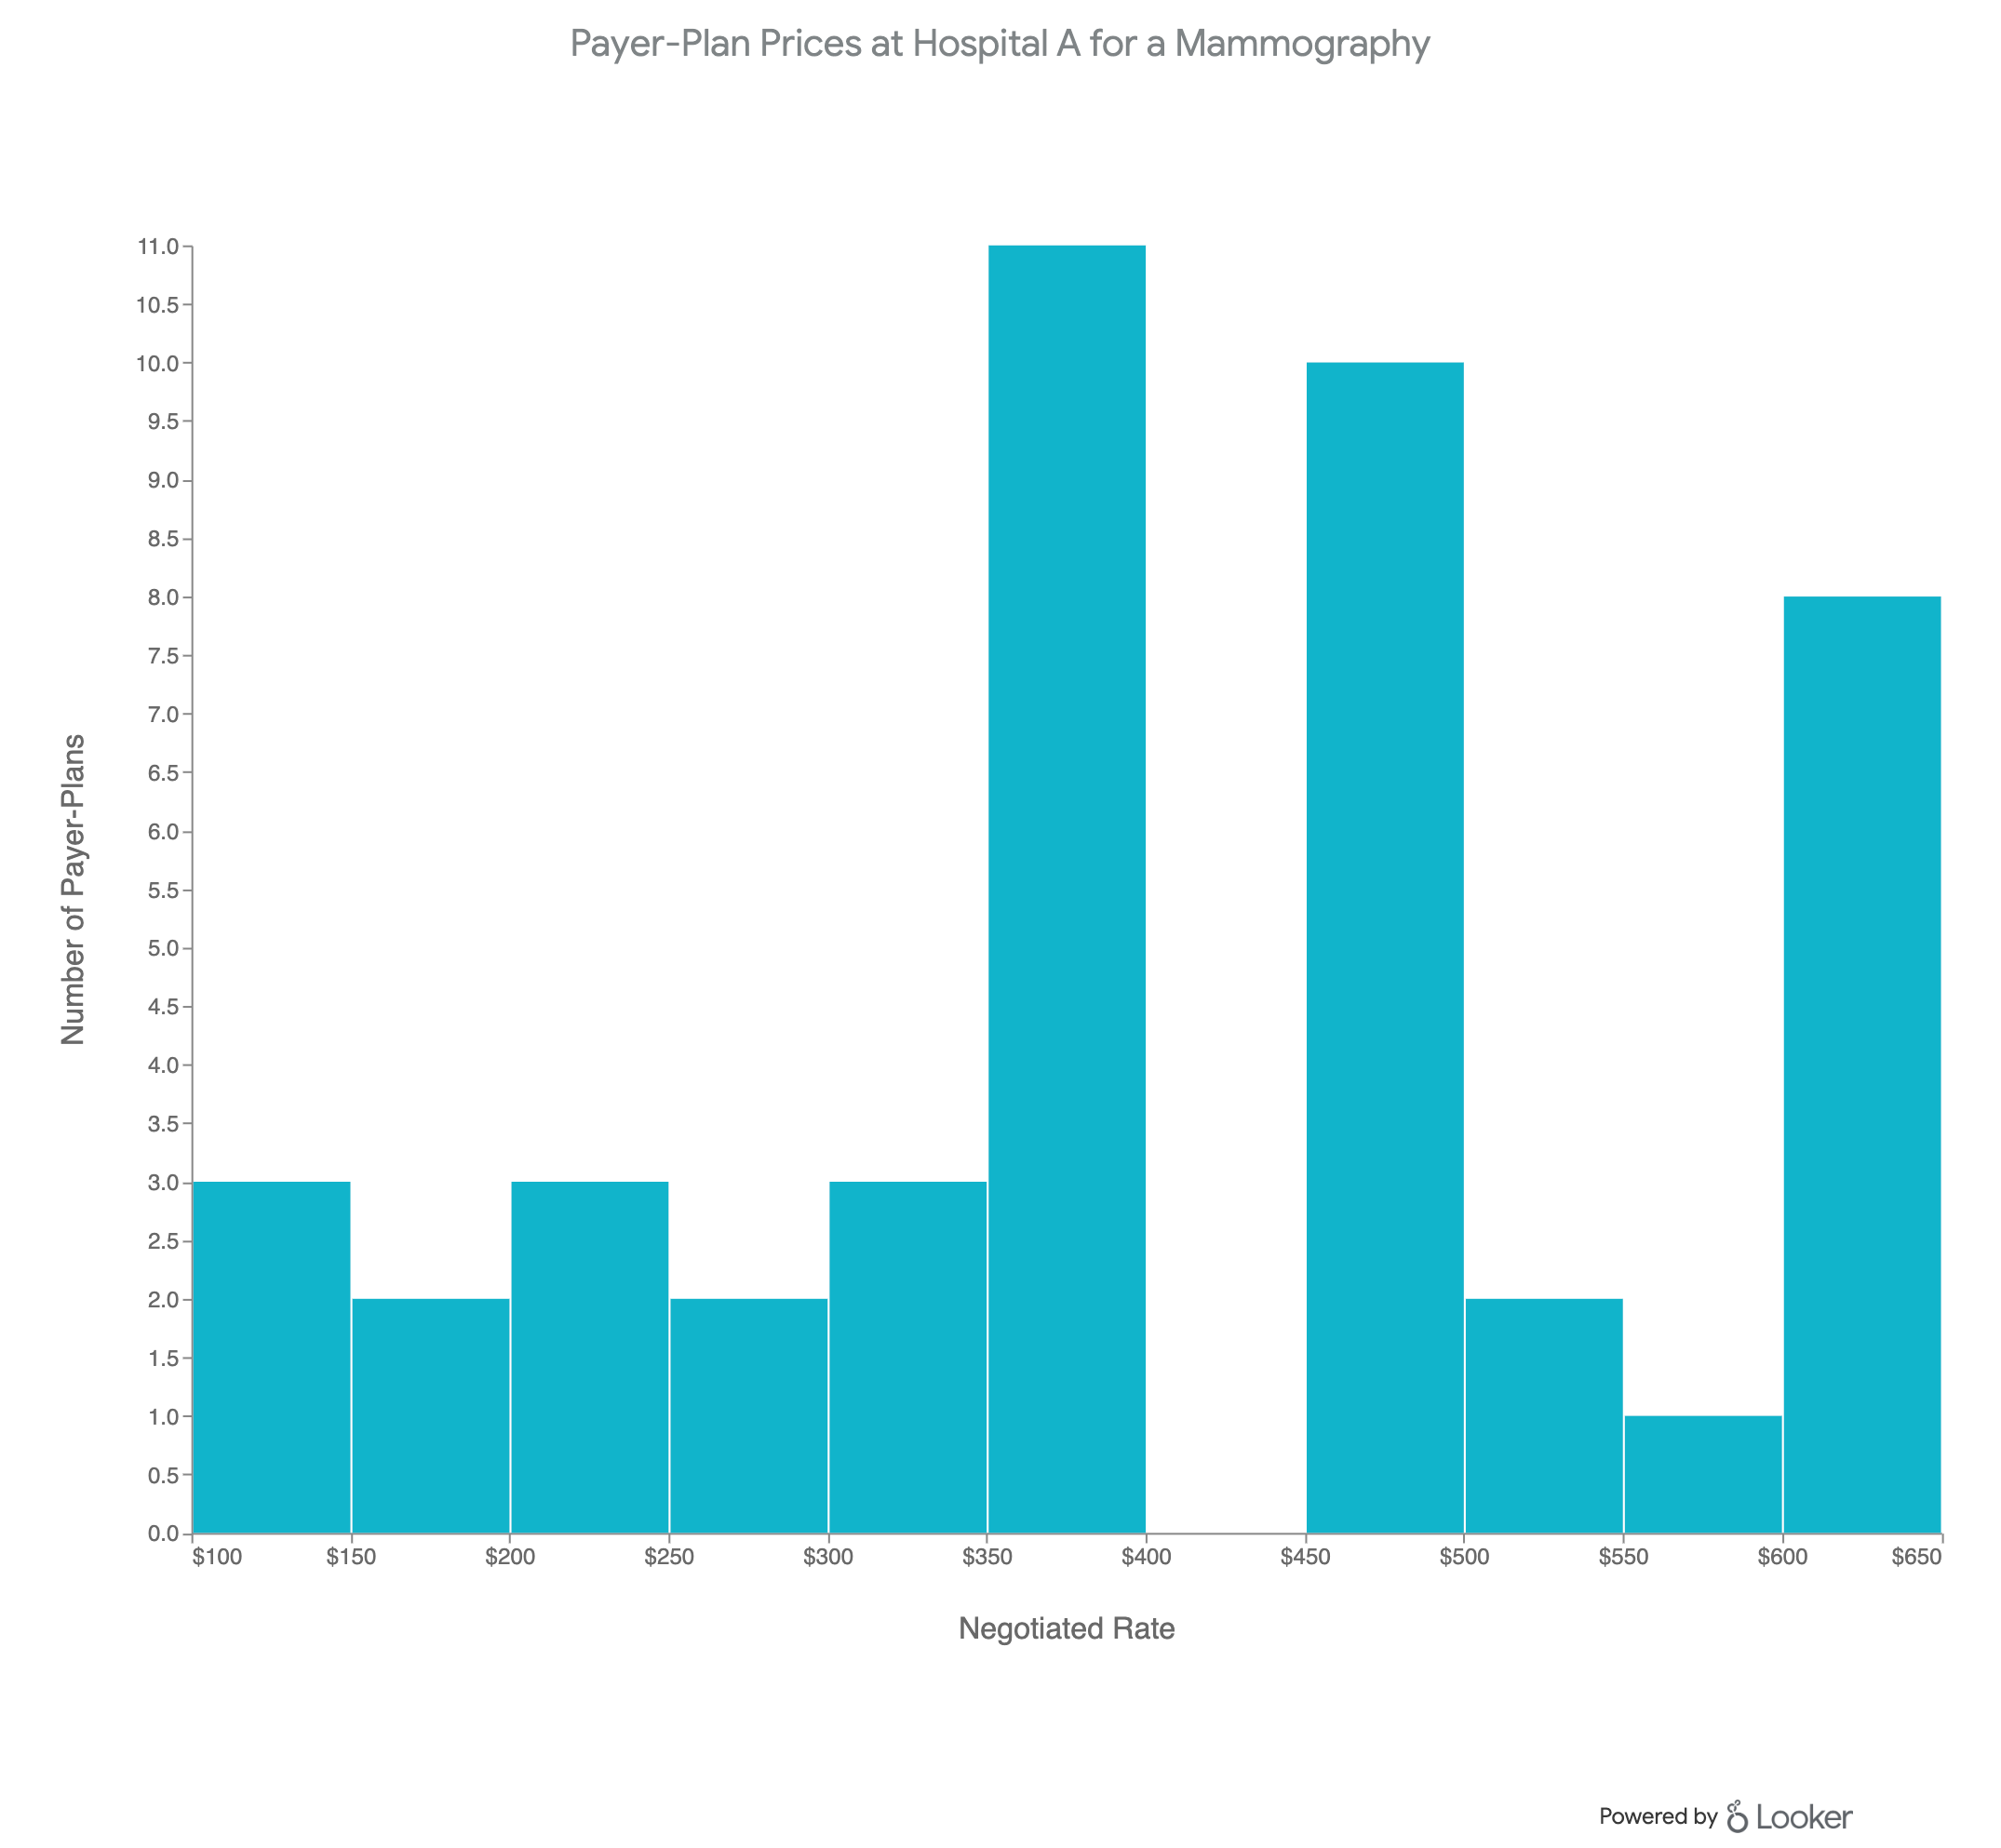
At hospital A (above), the range of prices negotiated with payers is large: from between $100 and $150 to $650 – for the same service.
At hospital C (below), the range of prices is tighter, from between $100 and $150 to $450.
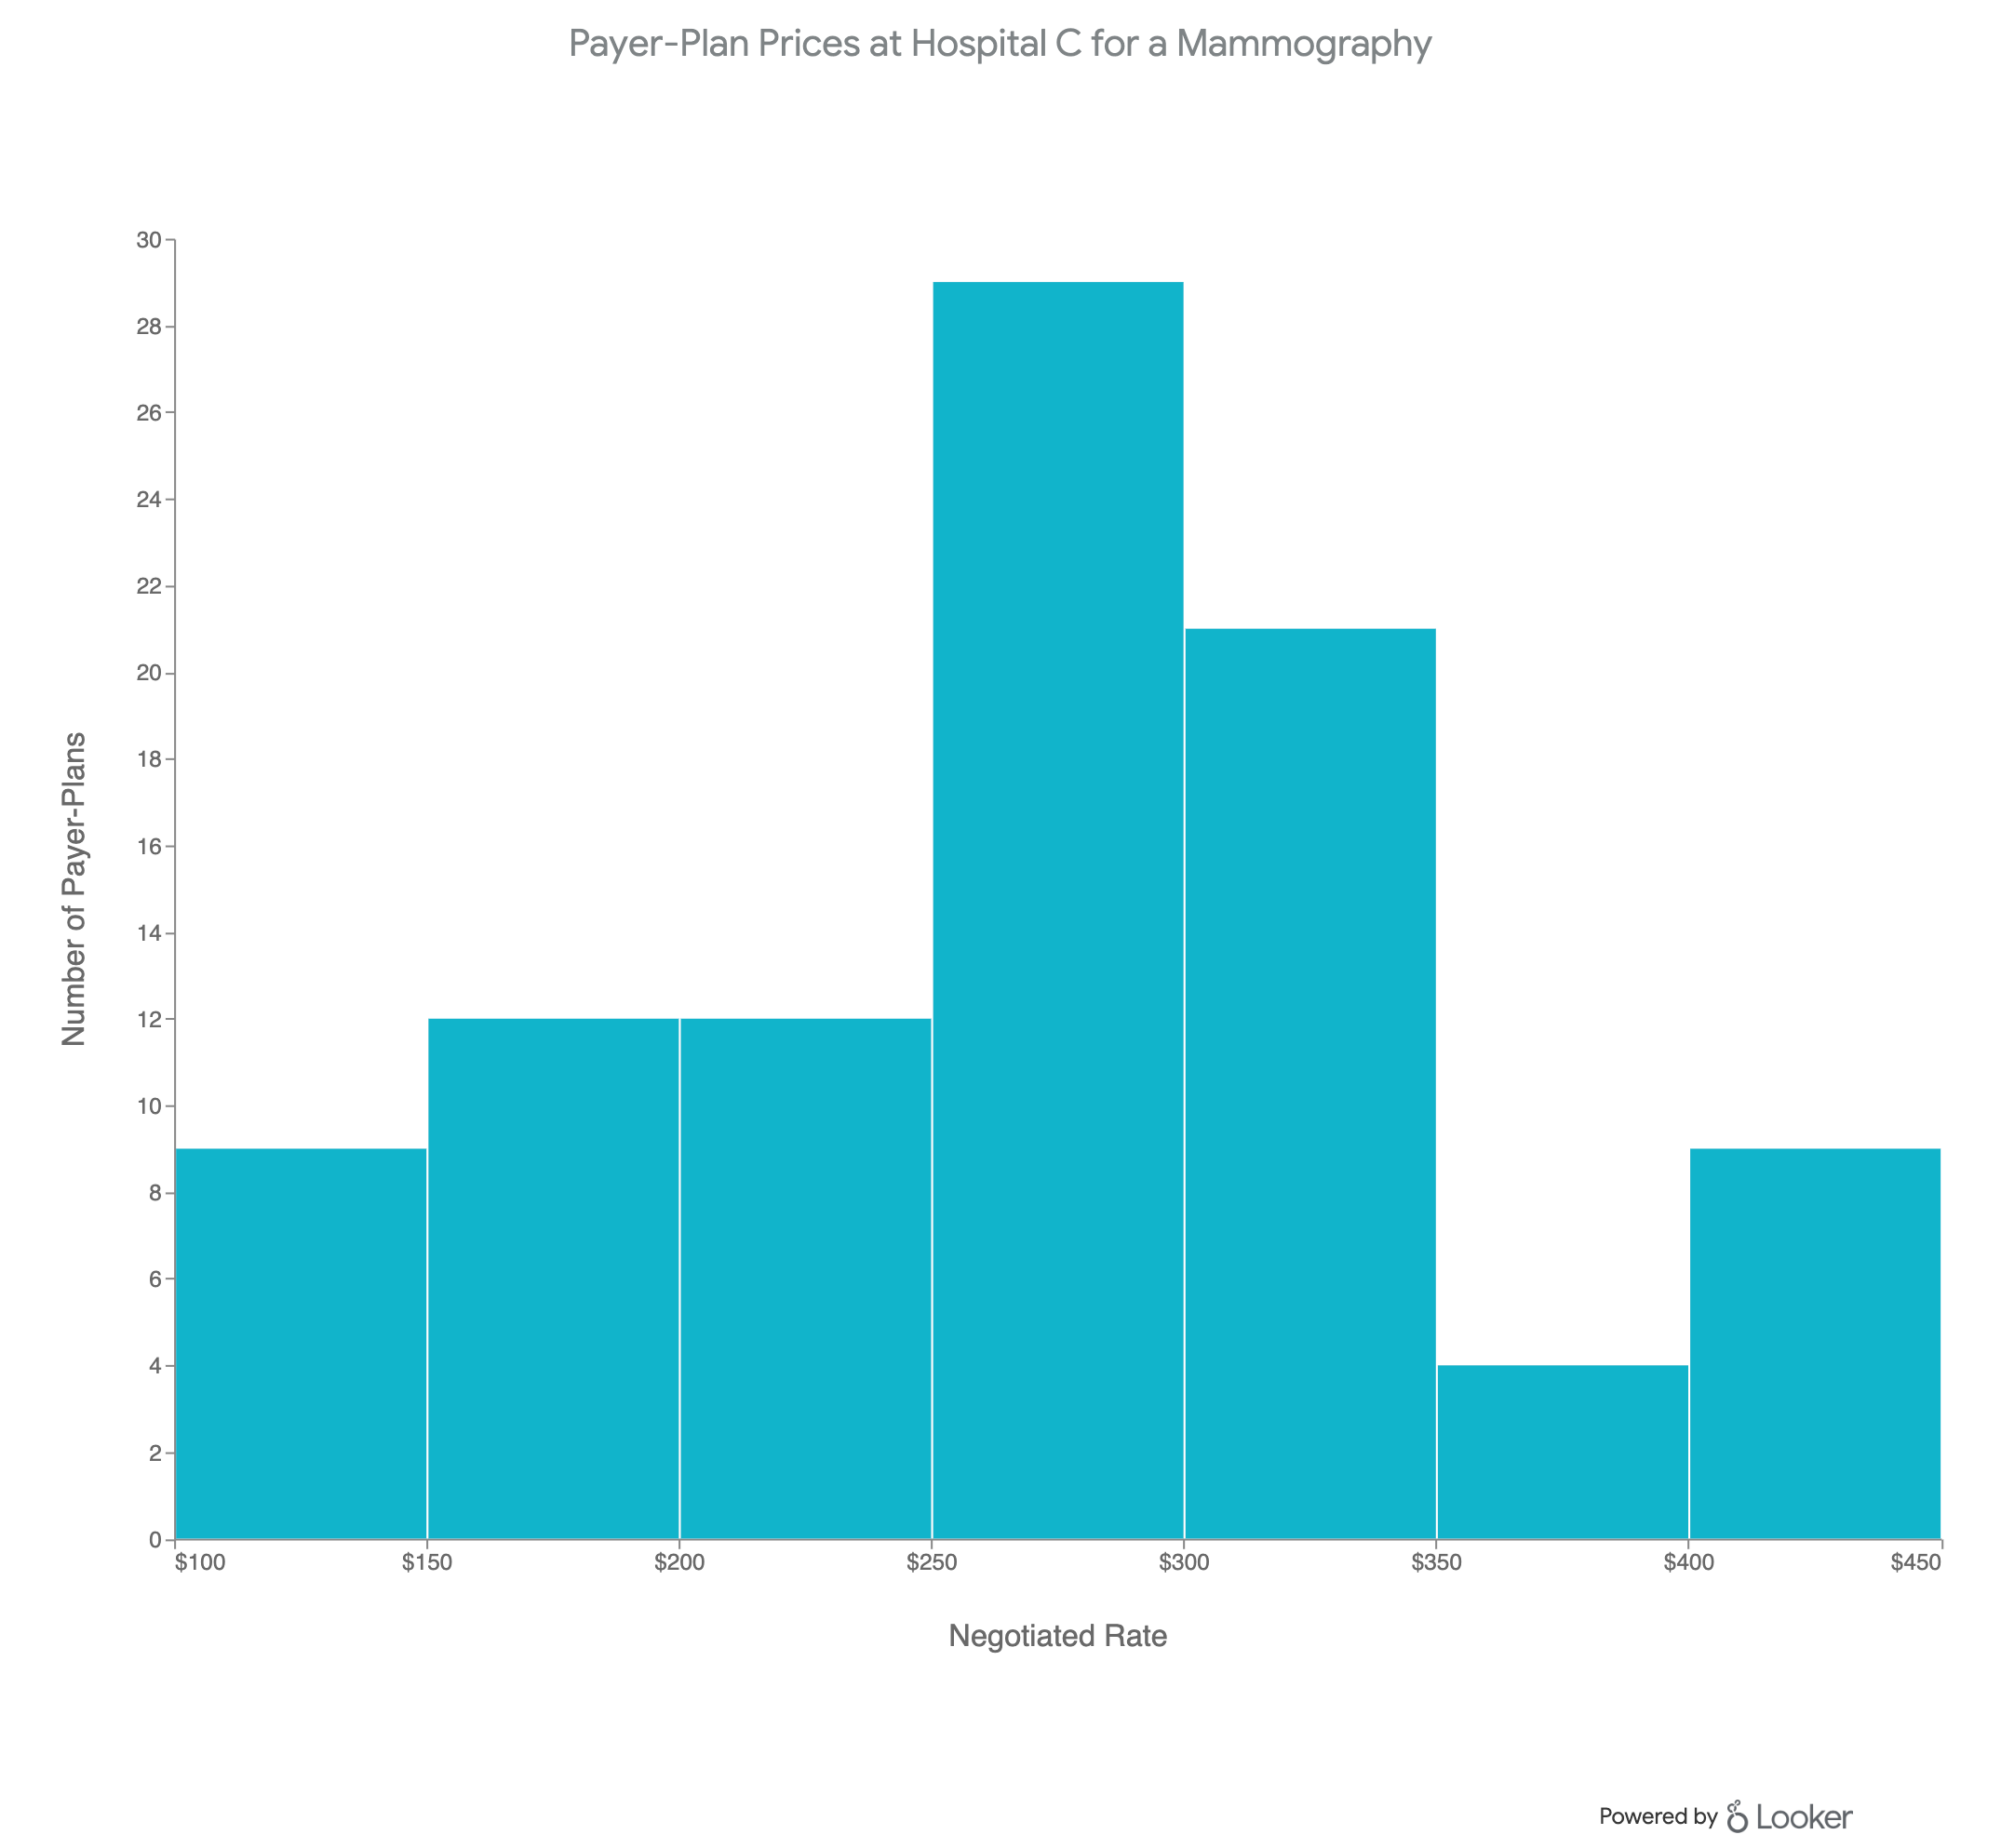
These ranges reveal why hospital service pricing confounds most patients. While it’s reasonable to expect price variation among hospitals for what can be considered a similar service, it’s confusing that a single hospital would charge different prices for the exact same service, depending on who’s paying.
Of course, none of this is news to hospitals.
We’re pointing this out – and illustrating how our analytics layer makes these realities newly visible – because, now that this data is widely available, hospitals may face greater scrutiny over why they charge what they charge (and to whom).
Leverage Analytics Insights to Make Key Business Decisions
Importantly, though, tapping into the power of our analytics capabilities can also make it possible for hospitals to make data-powered decisions that lead to the best possible outcomes to the patients they serve.
Knowing what competitor hospitals have negotiated with payers, for example, empowers hospitals to negotiate their own prices more competitively.
Understanding how prices compare among hospitals in a given region can guide marketing efforts to connect with the patients who most value the unique benefits your care offers.
And, of course, once you start conducting analysis of your own, you’ll start uncovering insights that can drive many other facets of your operations.
If you’d like a better sense of what our analytics capabilities make possible, let us know. We’d be happy to discuss which data can provide the most value to you – and how you’d like to see that data presented.
Last update: July 2024